
Your drawings already know how the plant fits together. Now the platform does too.
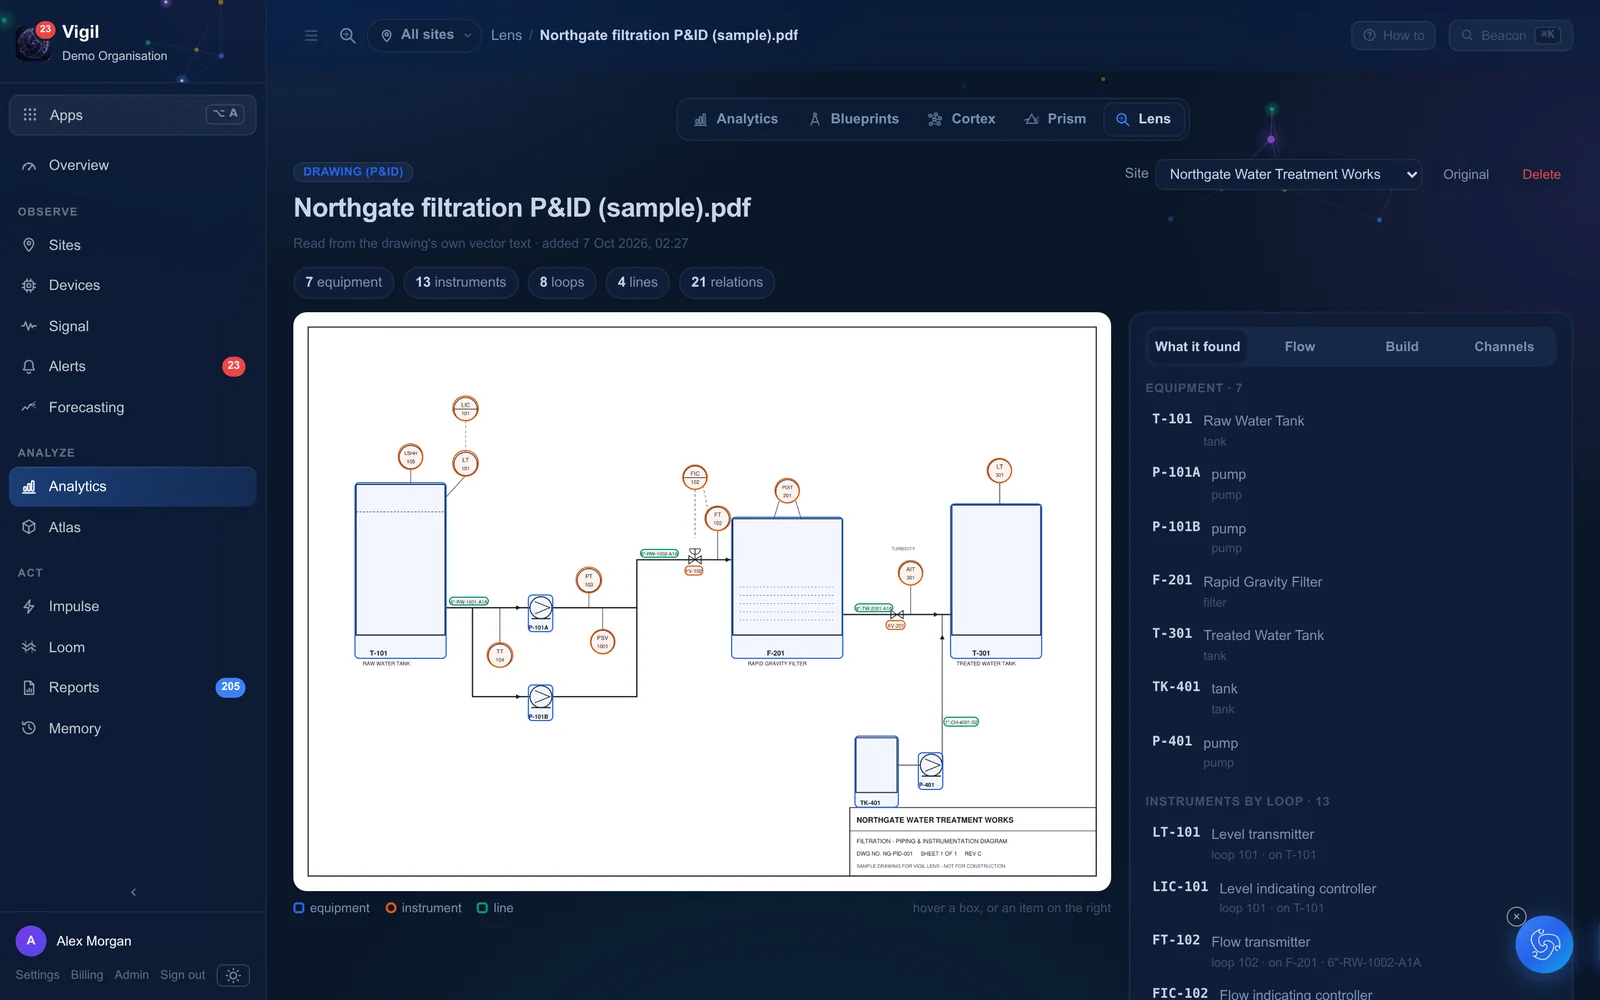
A P&ID is the most complete model of a facility anyone owns, and it usually sits in a PDF. Lens reads it: equipment, instruments, lines and control loops with their ISA-5.1 tags, built into a live graph and matched to the sensors that measure each part.
Lens reads the drawing.
Drop in a P&ID. Lens finds every vessel, pump, valve and instrument, reads their tags, follows the lines between them and works out the control loops. A drawing exported from CAD is read from its own text and geometry, so it is exact, quick and uses no AI credits. A scan is read by the platform's vision model, and its reading is marked for checking.
- Equipment, instruments, lines and loops, each with its ISA-5.1 tag
- What feeds what, what measures and controls what, and which relief valve protects which vessel
- Each instrument matched to the live channel that measures it, confirmed by a person
- One click builds the site's asset graph in Atlas
How it all connects.
The graph answers the questions a process engineer asks of a drawing: what is upstream of this transmitter, which loop it belongs to, the path from the raw-water inlet to the clear-water tank, which sensors watch each vessel. Argus answers them in words, and Atlas draws them, each part coloured by how it is doing.
- Upstream, downstream and the path between any two tags
- Loops kept to their instruments, so a pump is never counted as part of a flow loop
- The sensors on each asset, and the instruments on the drawing still waiting for a matching sensor
Open standards in, open standards out.
ISA-5.1
Instrument tags and function letters read and understood: FT-101 is a flow transmitter in loop 101, PSV-104 a pressure safety valve.
ISA-95
Every asset placed in the enterprise, site, area, unit and equipment hierarchy, so reports and questions roll up the way your organisation does.
Brick, Haystack and DEXPI
The whole graph, with its points and tags, exports as JSON-LD for building systems, digital twins and analytics tools, and as DEXPI for P&ID and engineering tools: equipment, piping, instrumentation and loops.
ISO 20816
Machine vibration judged in the zones the standard defines, and trended so a machine drifting towards zone C is noticed early.
ISA-18.2
Alarm load measured the way the alarm-management standard does: rates, floods, chattering and stale alarms, and the bad actors.
WHO and EPA
Air quality and noise against the WHO 2021 guidelines and US EPA standards, or your own permit limits, with their averaging periods.
Nameplates, gauges and photos too.
Point a phone at a motor's nameplate and its ratings land on the asset. Photograph a dial gauge and the reading becomes a dated record beside the live ones. Snap a site photo and what it shows is remembered with the place it was taken. Anything read by a model is marked as such until a person checks it.
And it remembers what it learns.
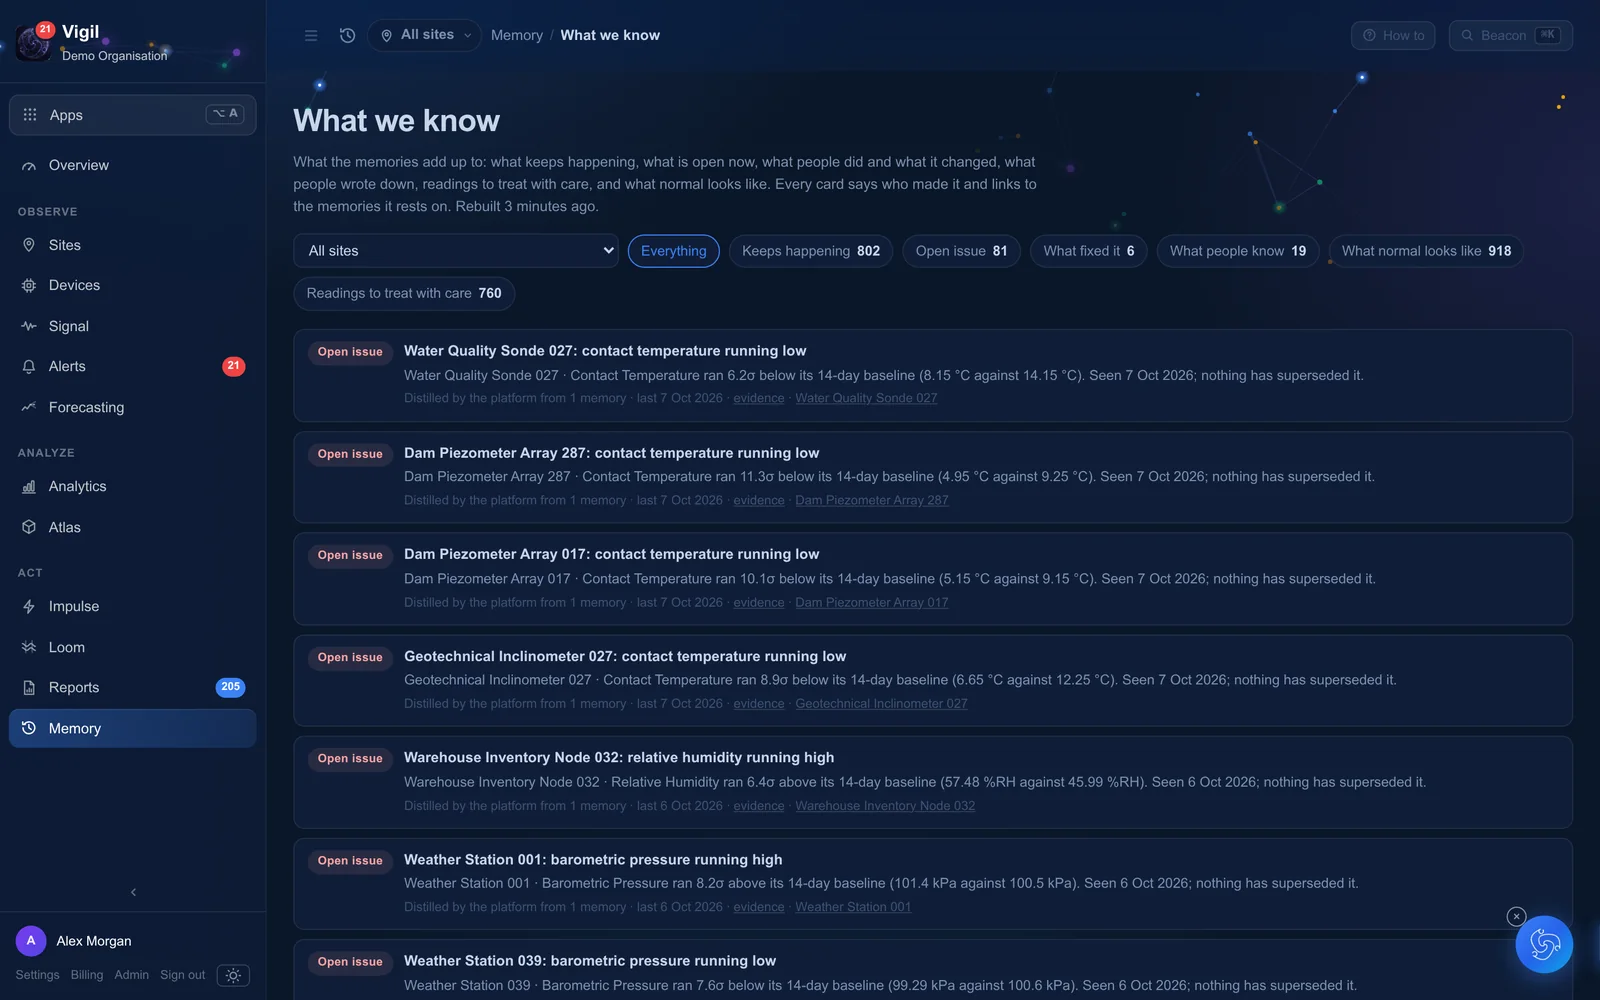
Every night the platform distils the site's memories into knowledge: what recurs and when, what normal looks like for each machine, what fixed it last time, what is still open, and the notes your people left. Argus quotes it, reports carry it forward, and a new starter can read it on their first day. Each card says who or what learned it, from how many occurrences, and when.
Let's make sense of your site.
Tell us about a site — a plant, a dam, a campus, a cold store. We'll show you the platform on demo data like yours and plan a pilot with nodes on your equipment.